Conversions report
Conversions report — the primary tool for viewing the results of conversion analysis in your traffic. Let's explore the features of this page.
Report overview
The main screen of the report consists of three major blocks: the Top panel [1], the Traffic quality panel [2], and the Detailed table [3]. By default, the data in the table is grouped by Affiliate to show aggregated statistics.
What to look out for on the main screen:
-
Top panel: the "Group conversions by" row indicates which parameter the data is currently grouped by (e.g., Affiliate); this allows you to see summary metrics for each partner without cluttering the table with hundreds of individual conversions.
Groups are a crucial tool for assessing traffic quality and risk levels. For example, grouping conversions by sources allows you to evaluate the fraud level in traffic from each source and decide whether to continue working with them.
-
Traffic quality panel: this block contains cards showing the distribution of traffic by risk levels:
- "Good conversions" (not suspicious),
- "Low fraud" (low risk level),
- "Middle fraud" (medium risk level),
- "High fraud" (high risk level);
- this section also displays the overall average fraudscore and the total number of conversions.
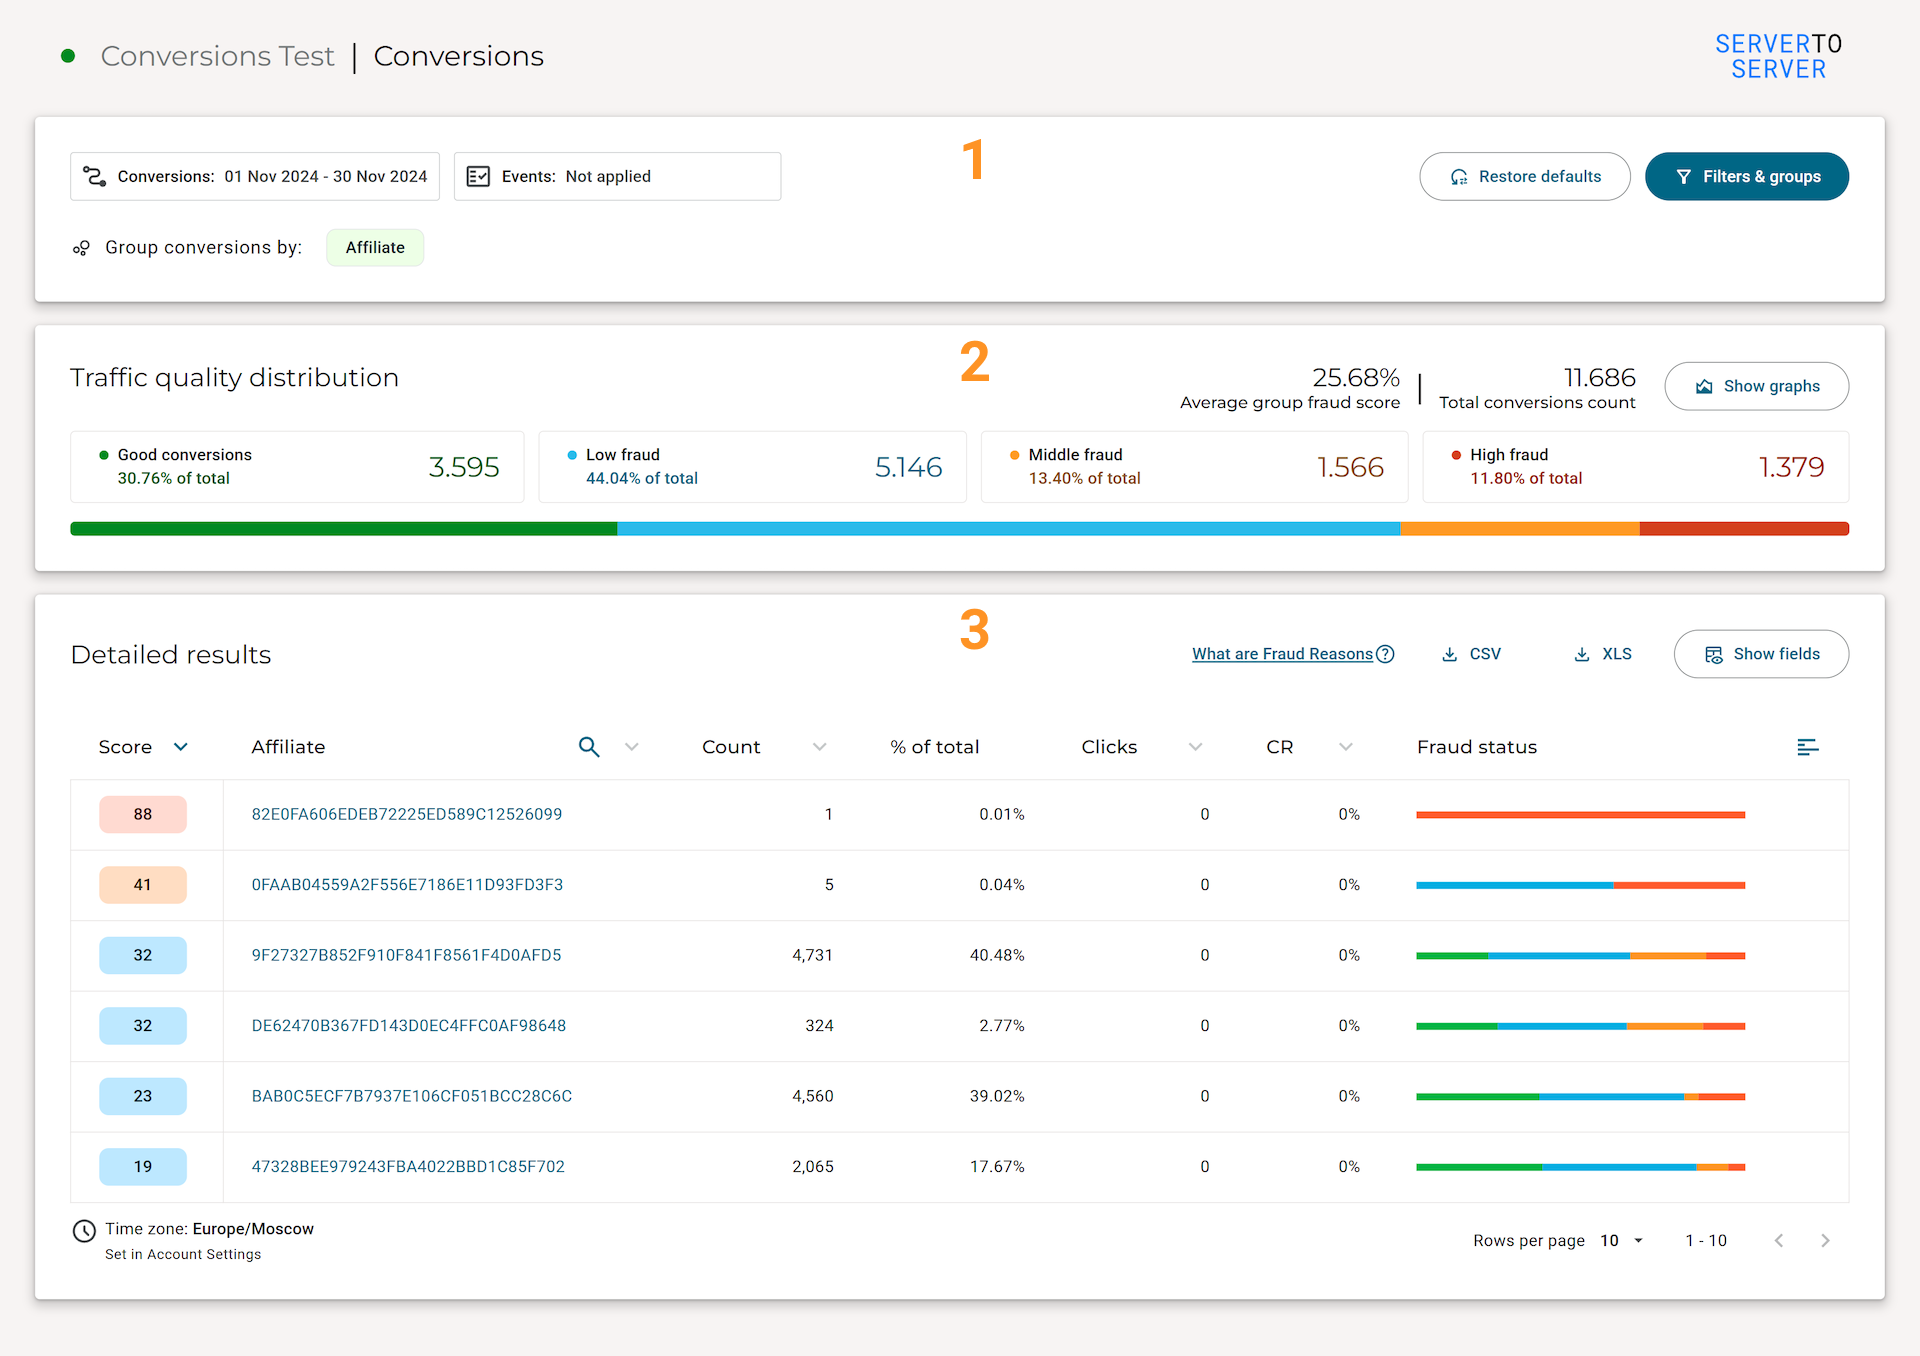
Top panel
The Top panel of the report contains the main tools for configuring data:
Conversionscalendar: sets the primary time period for which conversions should be displayed.Eventscalendar (optional): allows filtering conversions based on whether they have in-app events within the specified period; disabled and not applied by default; if dates are specified, the list will include only those conversions that have registered in-app events on the selected dates.Restore defaults: resets all interface settings to their default values, including both calendars, filters, groupings, and fields.Filters & groups: opens the Side panel for fine-tuning filters and data display.-
Display of active settings: the Top panel displays a summary of the applied settings; it appears as a multi-line set of text labels:
Group conversions by: shows the selected grouping parameters;Conversion filters: lists all active filtering conditions for conversions;Event filters: lists active conditions for in-app events.

Information
These labels are informational and non-interactive. You cannot click them to remove or modify a filter. This is designed so you can always see the conditions under which the current report was generated without opening the side panel. To edit these settings, use the
Filters & groupsbutton.
Traffic quality panel
This block contains cards showing the distribution of traffic by risk levels:
- "Good conversions" (not suspicious),
- "Low fraud" (low risk level),
- "Middle fraud" (medium risk level),
- "High fraud" (high risk level).
This section also displays the overall average fraudscore and the total number of conversions.
The Show graphs button toggles the visualization of traffic dynamics on a chart. You will get a clear visual representation of how traffic was distributed by day.
The "Fraud trends over time" chart displays lines of different colors corresponding to the risk levels on the Traffic quality panel. This helps to quickly spot spikes or anomalies on specific dates, which may indicate periods of active fraud.
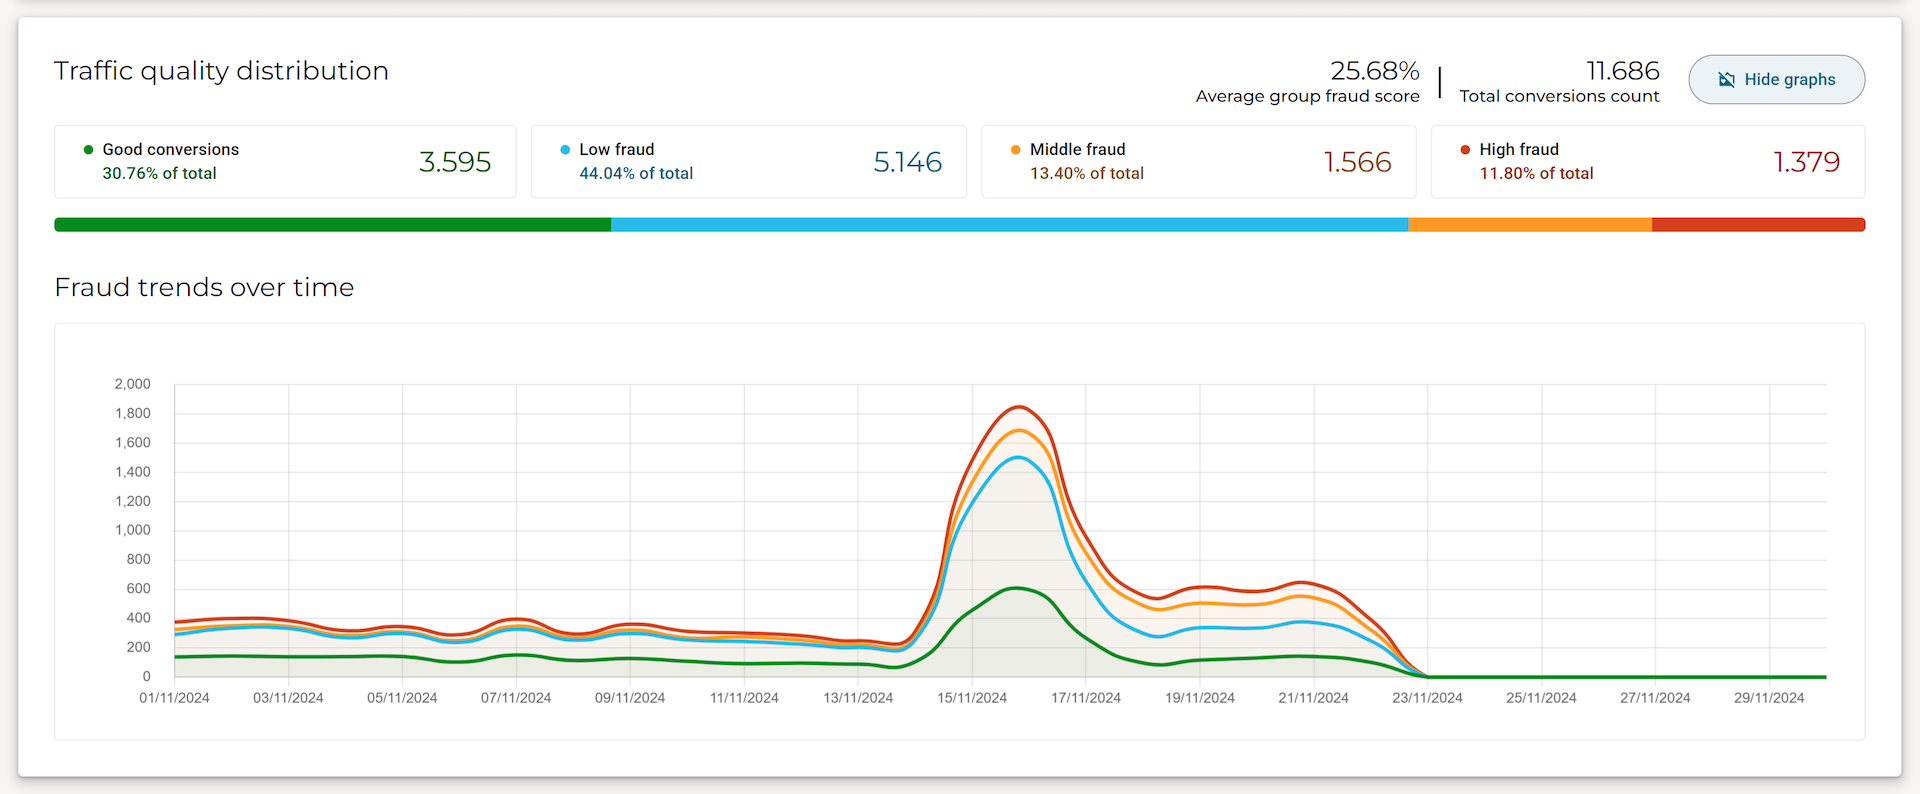
Side panel
Clicking the Filters & groups button opens the Side panel. This tool is essential for data analysis. It is divided into three logical blocks:
"Conversions filter" and "Events filter" blocks
Here you can build complex filtering conditions:
- select a parameter (e.g.,
Offer ID,Affiliate name,Device type); -
specify an operator:
equal- parameter matches the value exactly;not equal- parameter does not match the value;contains- parameter contains the value;in list- parameter is included in a comma-separated list of values;not in list- parameter is not included in a comma-separated list of values;
-
enter the value and click
Add filter.
"Group conversions by" block (Grouping)
Use this block to toggle data aggregation in the table. By clicking the buttons, you can group conversions by Offer, Affiliate, Advertiser, OS, Device type, and many other parameters. You can group data by multiple parameters simultaneously.
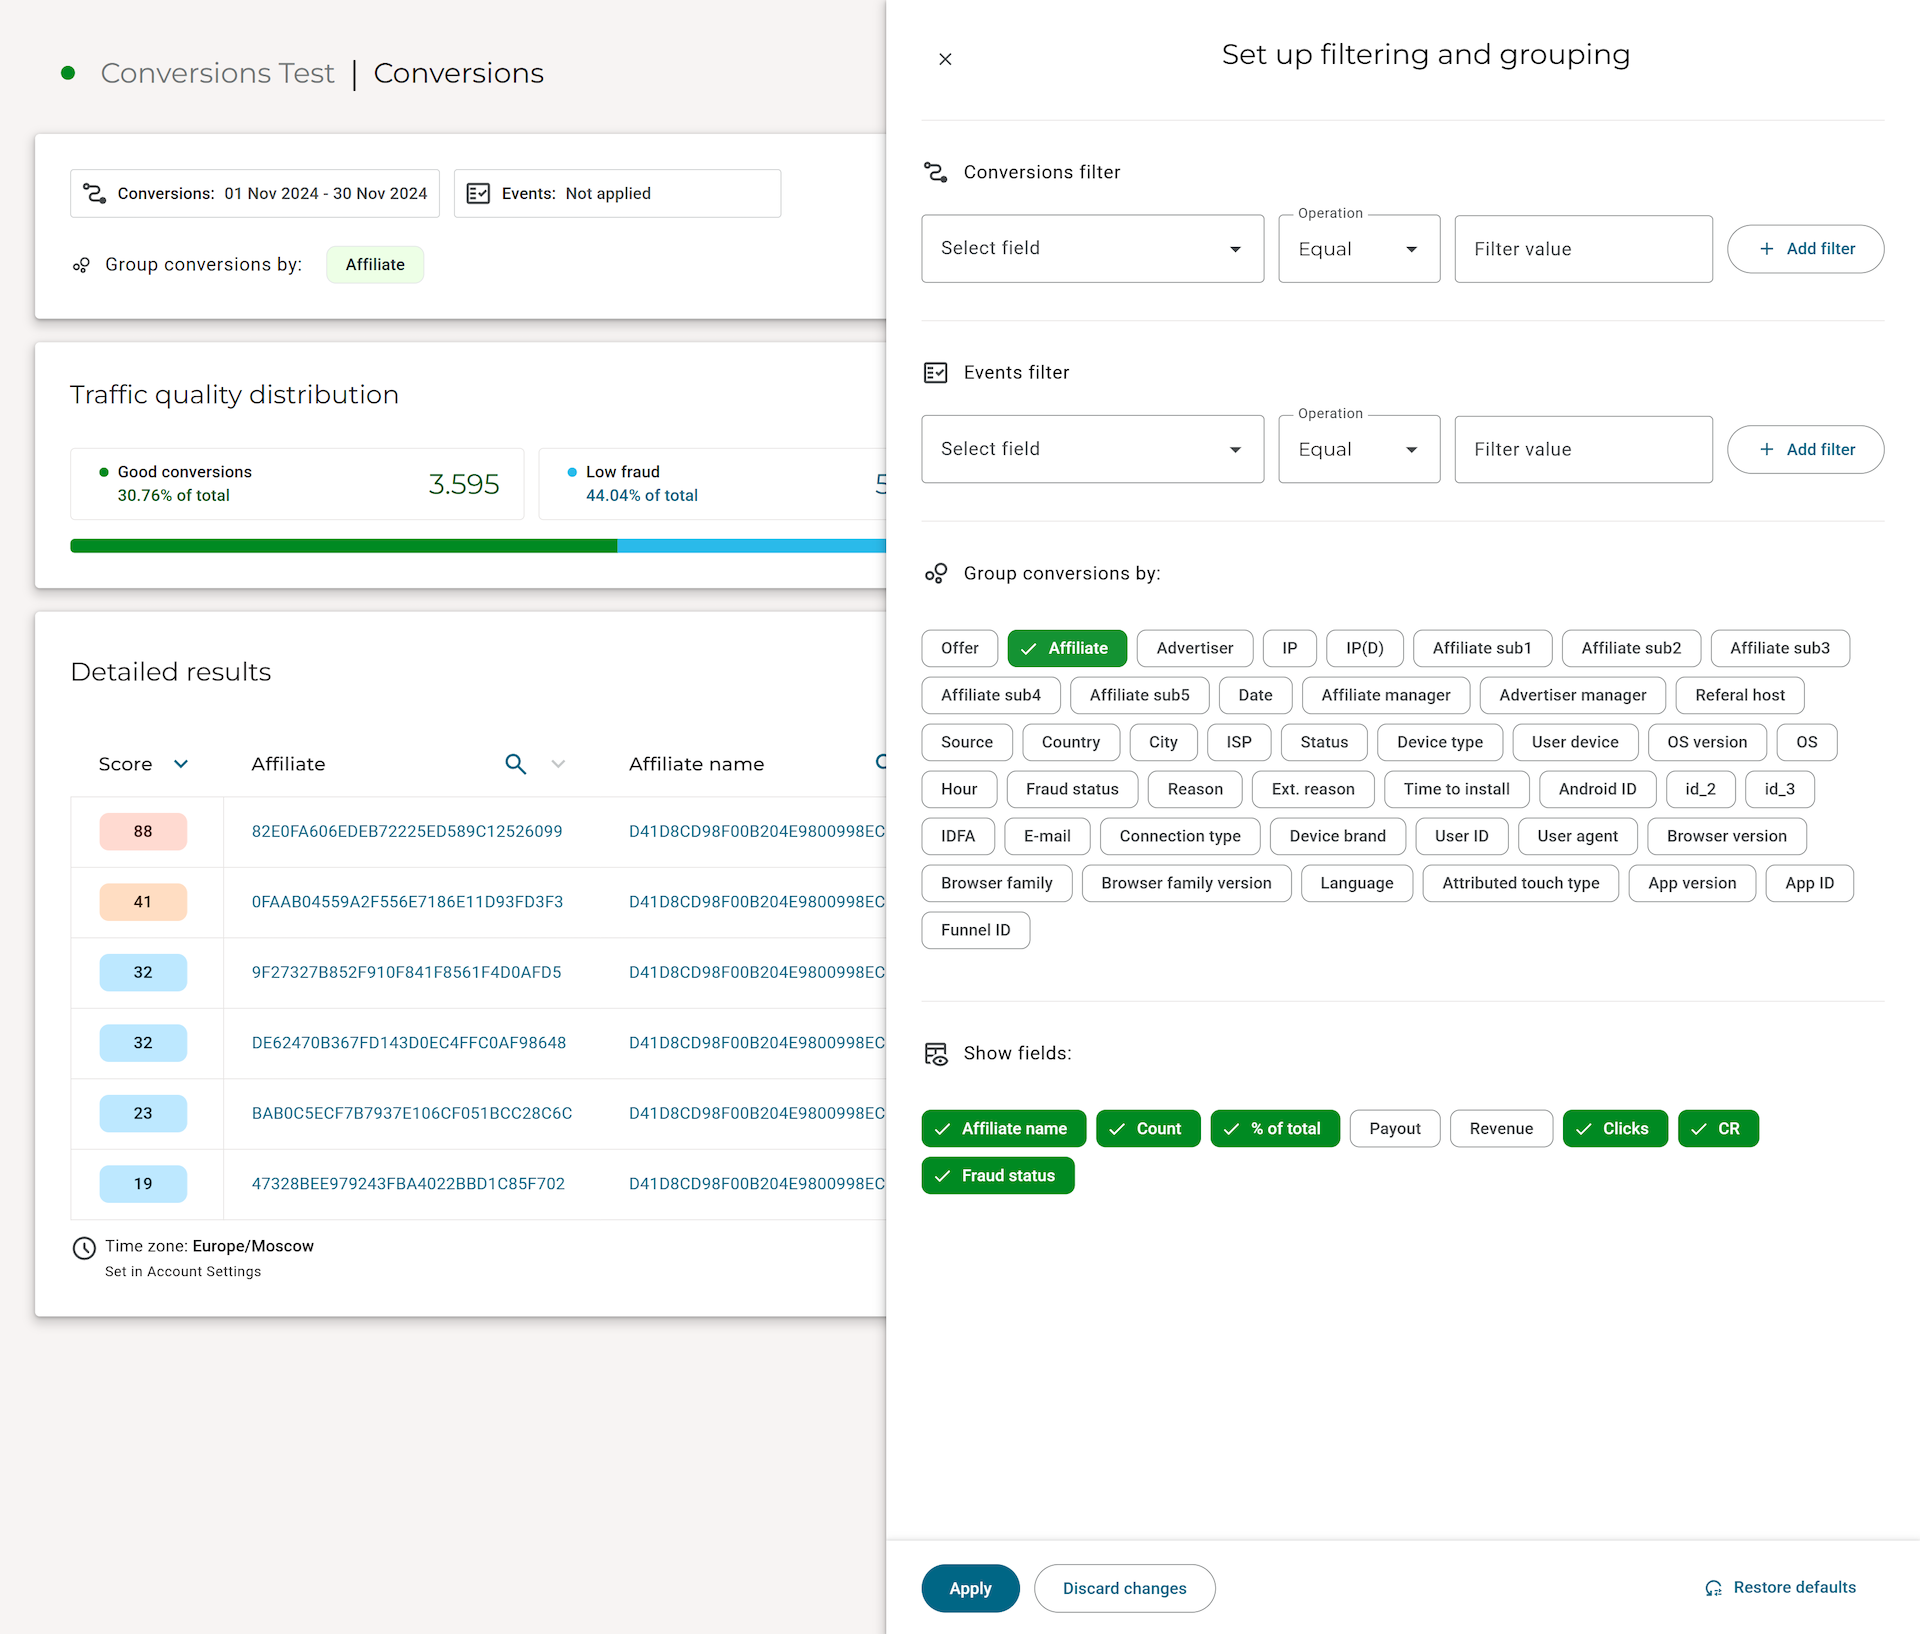
"Show fields" block (Displayed columns)
This block configures the columns displayed in the table (some columns appear only when the corresponding grouping is selected). In general, you can enable or disable the display of data such as:
Offer name,Affiliate name,Advertiser name;Affiliate manager name,Advertiser manager name;Count,% of total,Payout,Revenue,Clicks,CR(Conversion Rate),Fraud status.
Information
As soon as all selected labels are removed from the grouping block — in other words, grouping is disabled — the list of available columns in the "Show fields" section expands significantly. Detailed fields that cannot be displayed in an aggregated table (such as the exact conversion time) will appear.
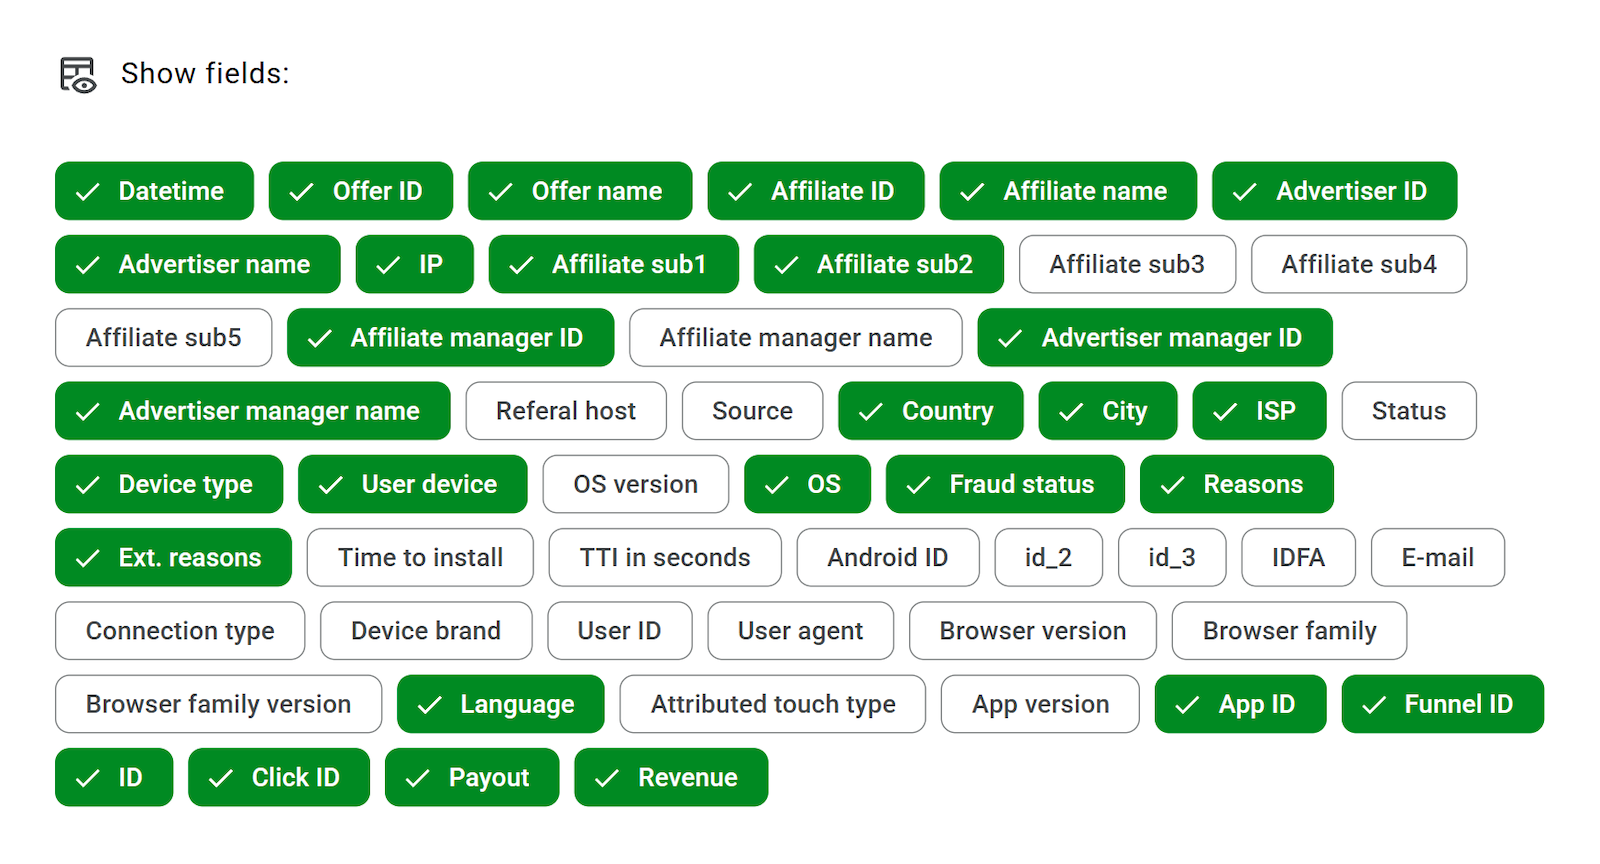
Information
The Discard changes button cancels all modifications made in the side panel that have not yet been submitted using the Apply button.
Information
The Restore defaults button is also located at the bottom of the side panel. Please note: it does not affect the calendar settings (date range) on the main screen. Its action is limited strictly to the settings within the panel itself: it clears all added filters, resets groupings, and restores the standard set of displayed columns.
Changes are not applied automatically after clicking this button. For them to take effect, you must click the Apply button in the bottom left corner of the panel.
Detailed table
The main part of the screen is the data table (Detailed results). Interacting with it has several important features:
Interactive elements at the top of the table:
Show fields: opens the Side panel to manage columns (which fields to display in the table).CSV/XLSexport: allows downloading the current dataset in the chosen format for external analysis.What are Fraud Reasons?: a link leading to the knowledge base for a detailed explanation of the fraud reasons for assigning fraudscore points.
Managing sorting and local search:
- Search within a column: click the magnifying glass icon in the header of the column you are interested in; enter a value; this will create a
containstype filter for the selected parameter without the need to open the side panel. - Sorting: click the arrow icon in the header of any column to sort the data in ascending or descending order.
Interactive values (Quick filters):
- Pay attention to the values in the table cells highlighted in blue; if you click such a value (for example, an Offer or Affiliate Name), the system will automatically open the
Filters & groupsside panel and pre-populate the filter field with theequaloperator for this parameter; you will only have to clickAdd filterandApplyto filter the list.
Fraud status chart:
-
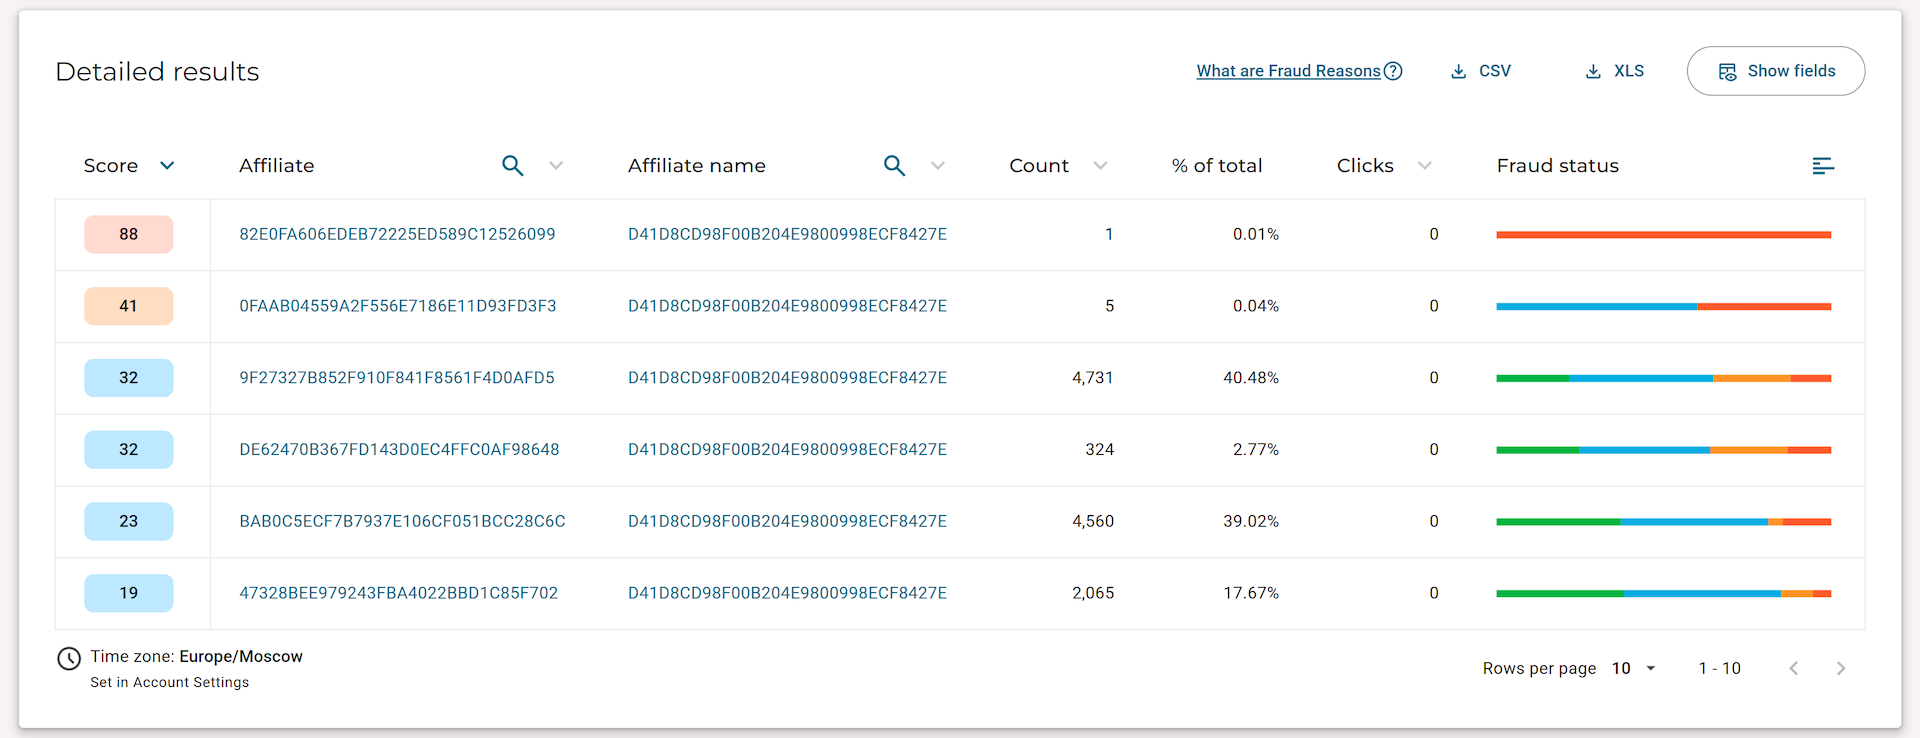
The "Fraud status" column is a bar chart visualizing the fraud status for each table element broken down by risk level. When clicking the button in the column header, the length of the bars will change to proportionally match the total volume of traffic.
-
Hovering the mouse cursor over the colored chart slices displays a tooltip showing the percentage and number of conversions in each risk zone.
Grouping and drill-down:
- If grouping is selected in the side panel (for example, by Affiliate), you will see summary metrics for each affiliate in the table: the number of conversions, total percentage of all conversions, average fraudscore, etc.
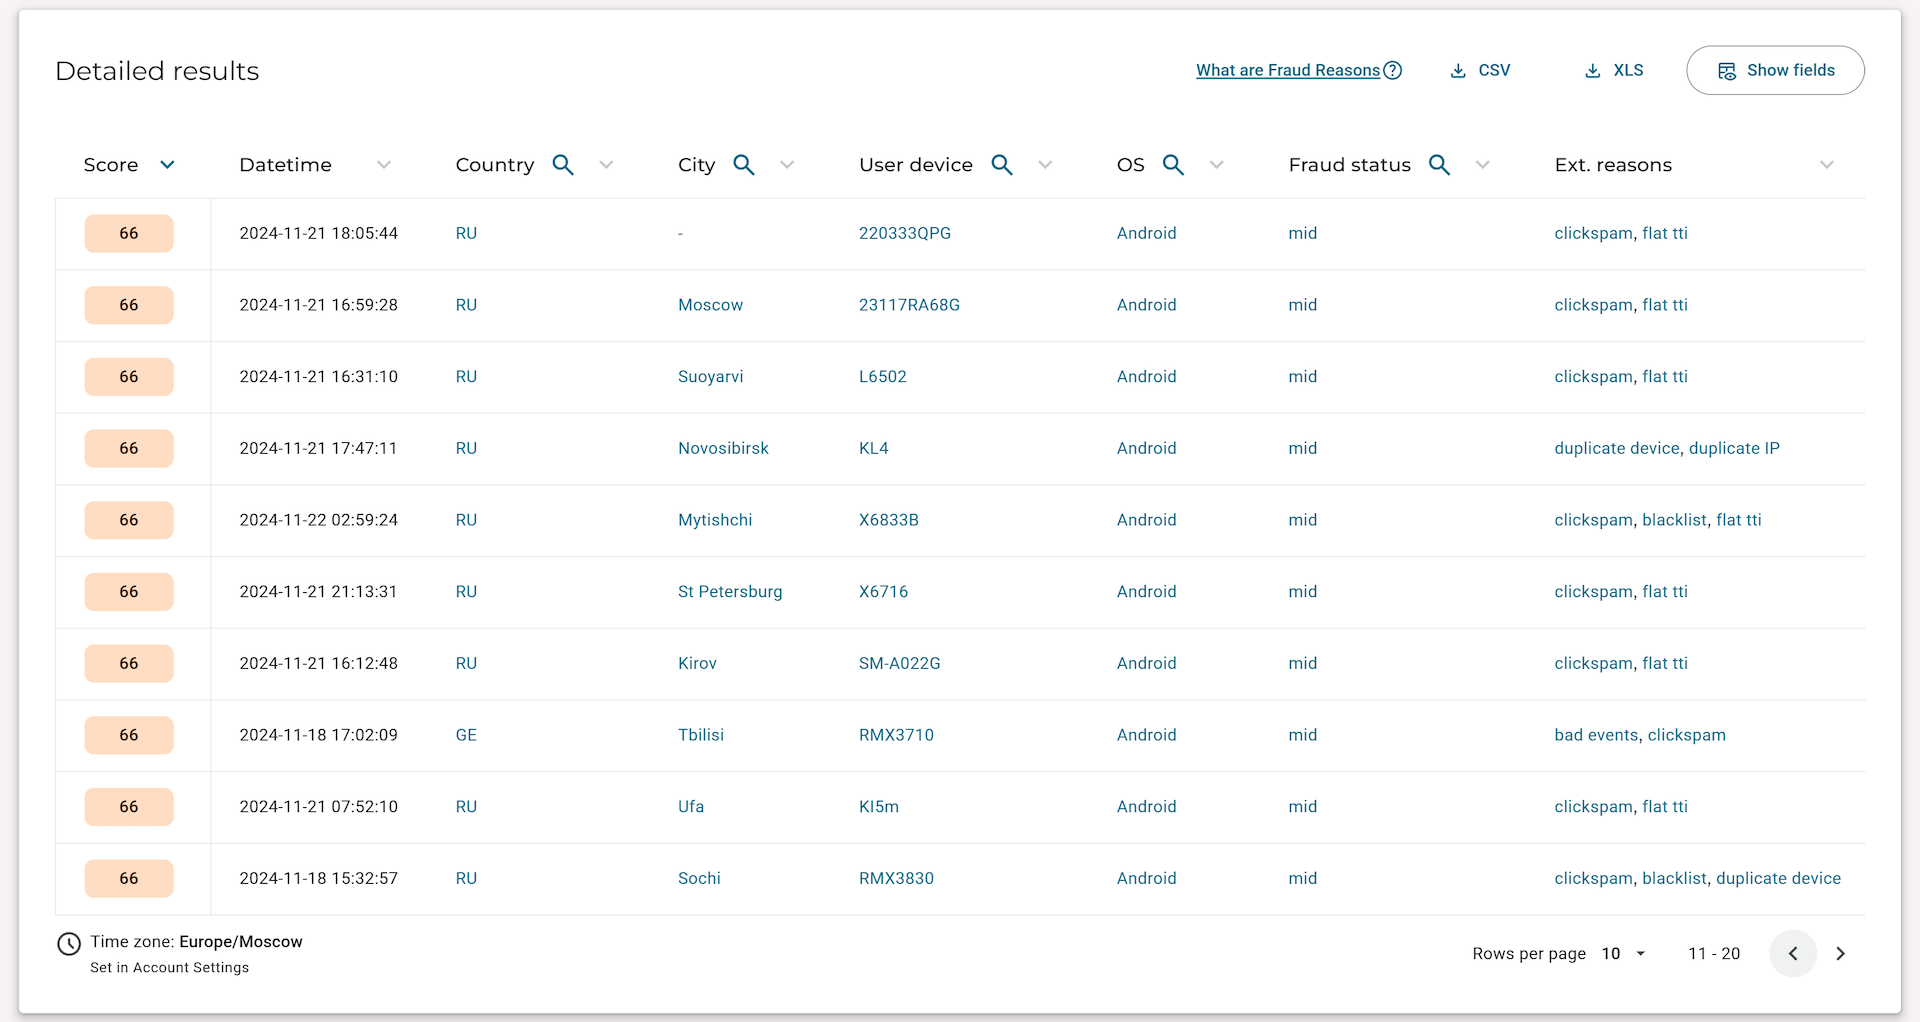
- If you disable all groupings, the display mode changes; the table stops showing aggregated numbers and turns into a list of each individual conversion; this allows you to examine every single conversion in detail (for example, the exact time, city, device, individual fraudscore for that specific conversion).
Previous version
Attention
Below is the description of the previous version of the Conversions Report screen. This section has been temporarily added for compatibility with articles regarding the cohort report, re-attribution reports, and event reports.
Filters
FraudScore provides extensive data filtering capabilities.

The image above highlights:
- Field for selecting the period for conversions;
-
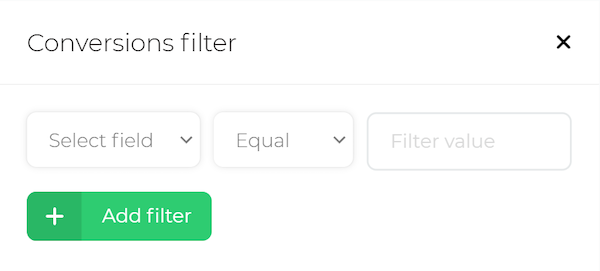
Button for additional conversion filters, clicking it activates a panel:
- Available fields for filtering:
Offer ID/Name,Affiliate ID/Name,Advertiser ID/Name,Funnel ID; - Available conditions:
equals,not equals,contains,in list,not in list.
- Available fields for filtering:
-
Toggle and field for selecting the period for events (this filter is turned off by default);
Event Date Filter
By default, when the event date filter is disabled, the report displays conversion data without considering event dates. Enabling this filter will show only conversions that have events occurring within the selected period.
-
Button for additional event filters, clicking it activates a panel:
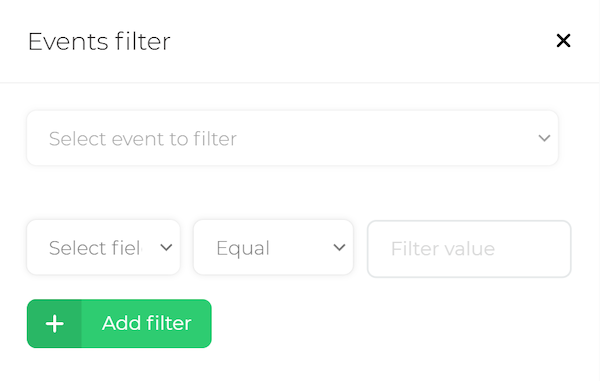
- Separate filter available by event name;
- Available fields for filtering:
id_3,Aff sub 3,Funnel ID; - Available conditions:
equals,not equals,contains,in list,not in list.
-
Button to display the Timeline;
- Button to the FraudScore Help page with a description of Extended Fraud Reasons.
Groups
This section offers the ability to group data by a wide range of parameters.
The most commonly used groupings by Offers and Affiliates are placed in the left sidebar for quick access.
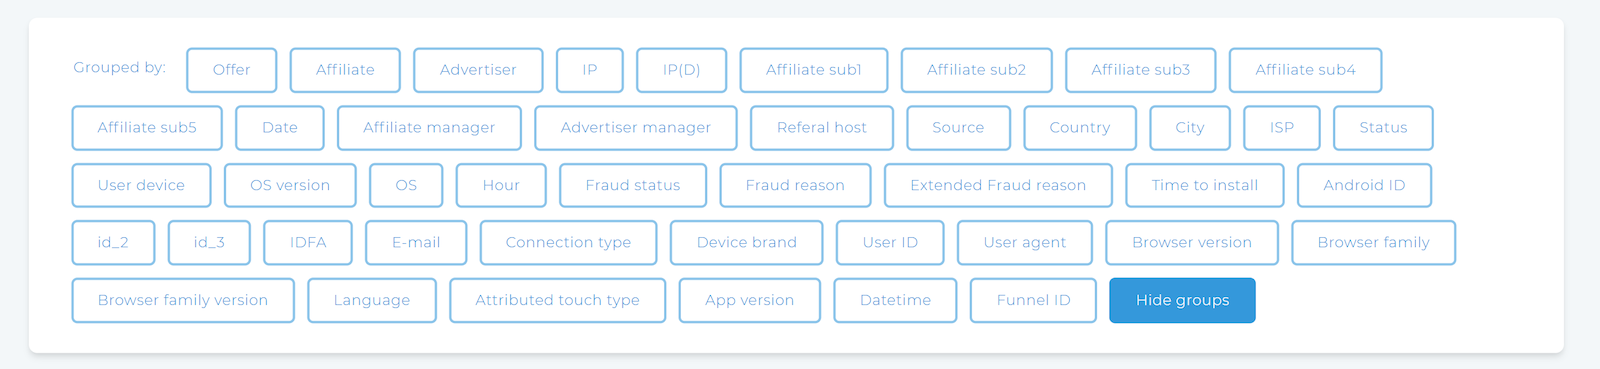
Groups are a crucial tool for assessing traffic quality and risk levels. For example, grouping conversions by sources allows you to evaluate the fraud level in traffic from each source and decide whether to continue working with them.
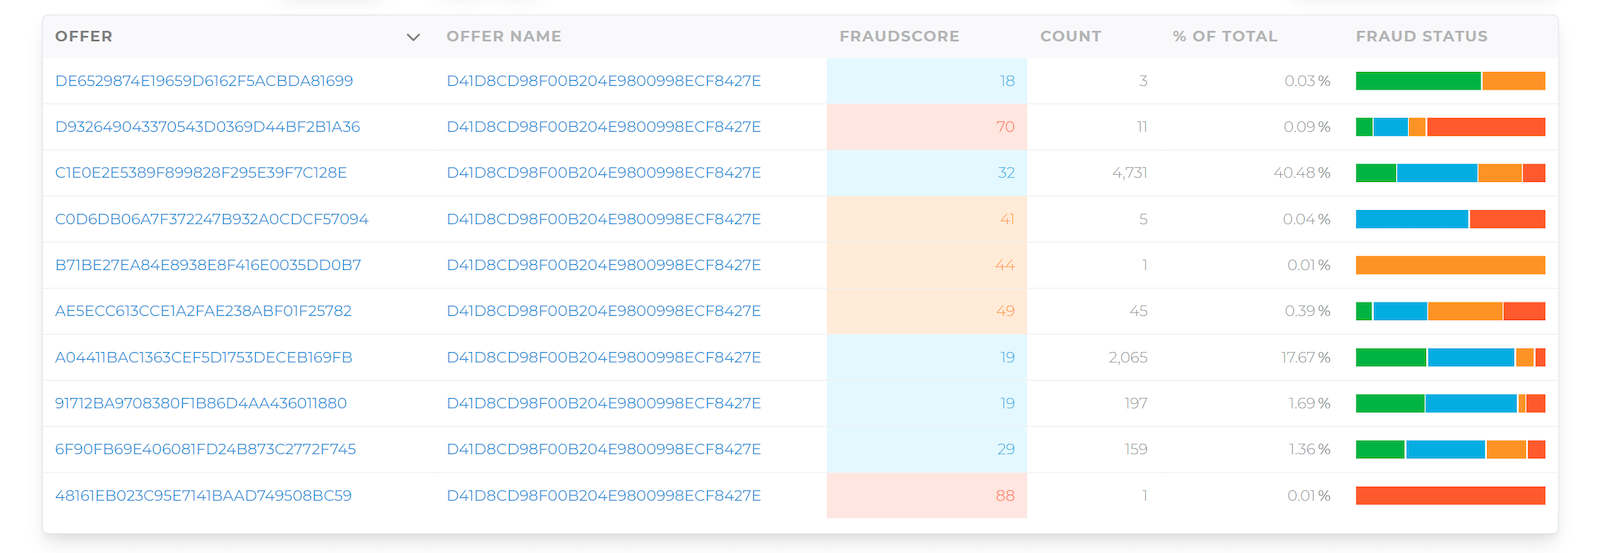
Click on the desired parameter in the groups section to activate it, and the data in the table will instantly rearrange according to the selected parameters. Example of a data table grouped by Offer:
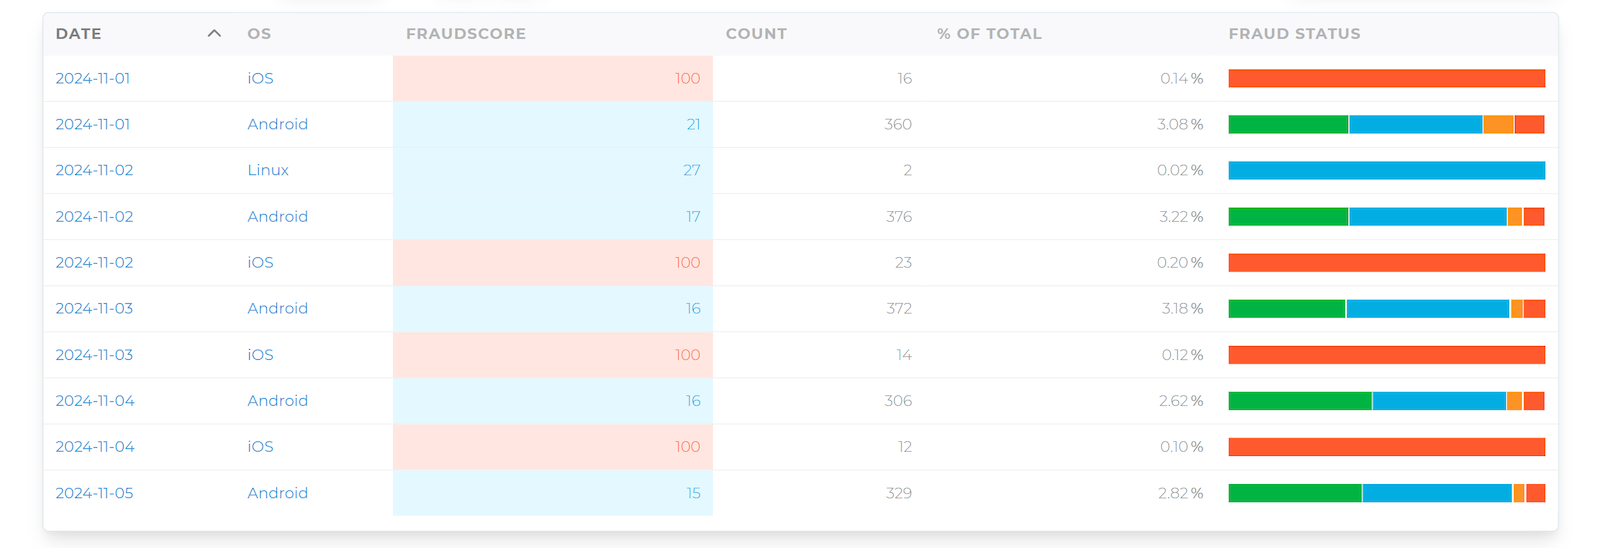
Groups can be freely combined, activating two, three, or more. Example of a data table grouped by Date and OS (operating system):
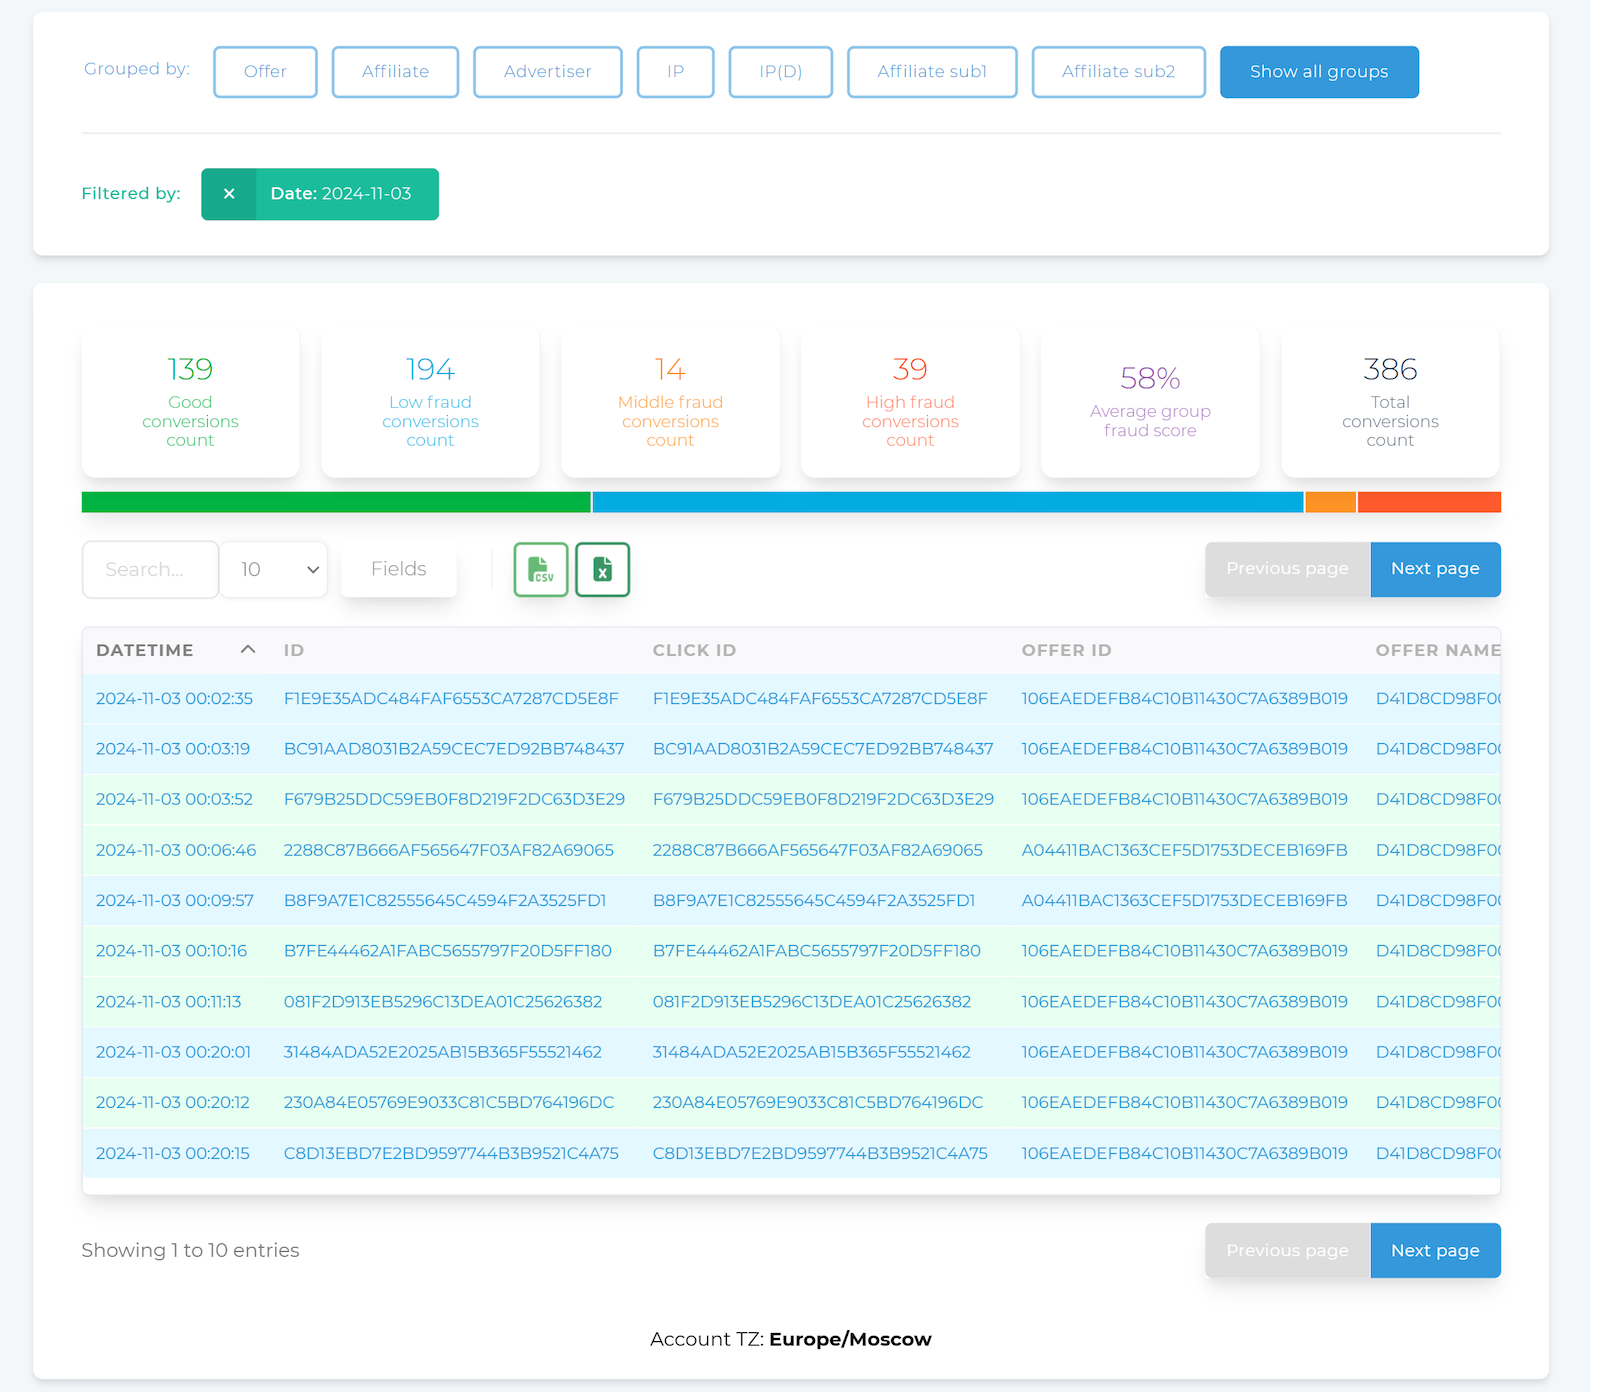
The parameter values used for grouping are clickable. Clicking a value activates a filter for that value and displays the list of conversions in the data table.
For example, in the image below, clicking the date 2024-11-03 activated the corresponding filter.
Fraud Index
The Fraud Index widget is always present in the report and provides an initial assessment of traffic quality for the selected dataset.

It consists of blocks divided by risk levels:
- - non-suspicious traffic;
- - low risk level;
- - medium risk level;
- - high risk level.
Additionally:
- Average fraud score for all analyzed conversions;
- Total number of analyzed conversions.
The division by risk zones is also presented as a bar chart for visual assessment of the size of each zone. Hover the mouse cursor over a zone to see more details.
Data table
The data table displays detailed information about your traffic based on the configured filters and groups. If no groups are selected, individual conversions will be displayed.
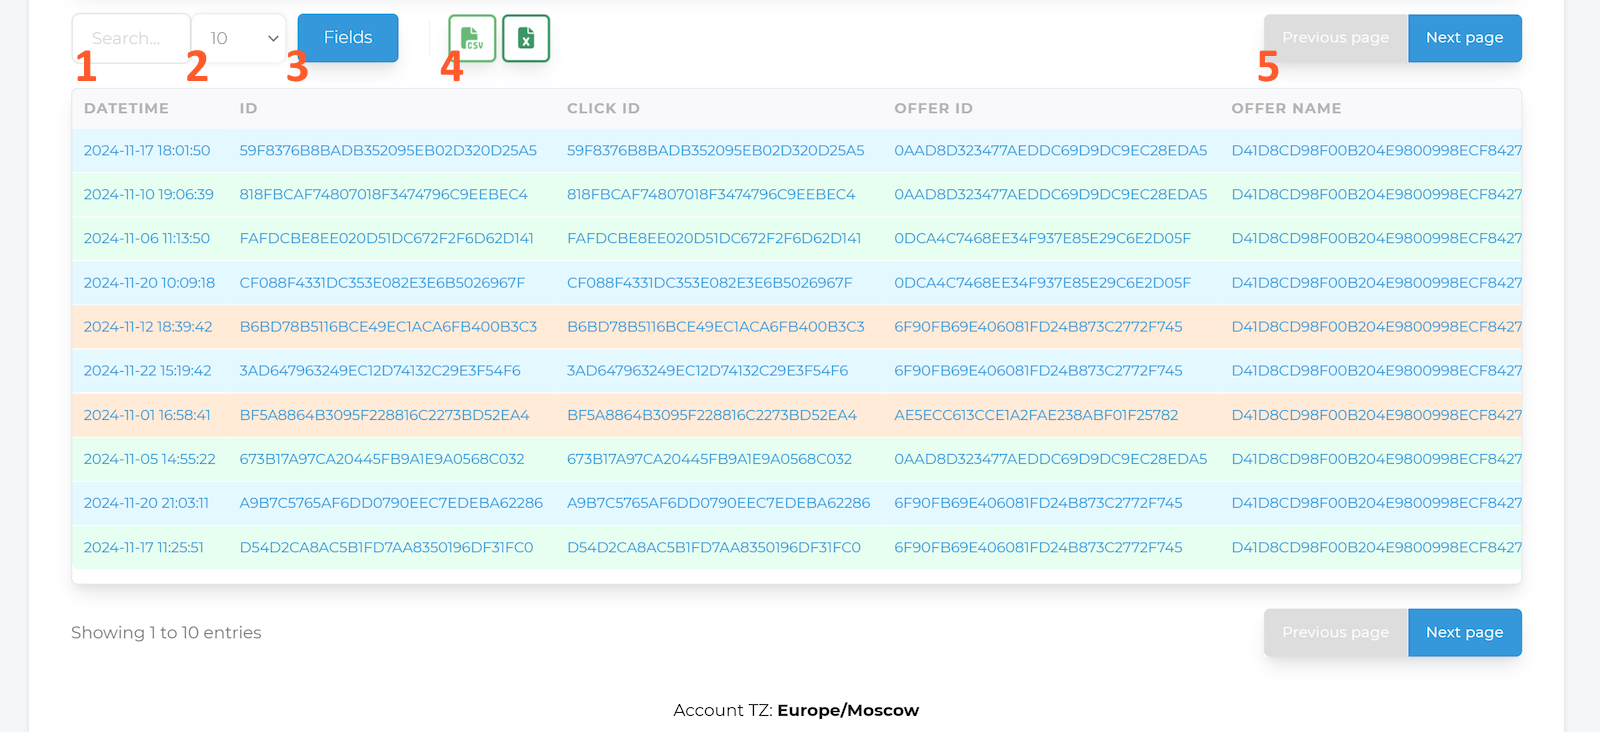
The image above highlights:
- Quick search field, allowing filtering of table records (search is performed only on visible fields);
- Setting for the number of records displayed on a single table page;
-
Button to activate the selection of visible fields, displaying an additional section with a set of fields that can be toggled by clicking; the set of available fields depends on the enabled groups:
-
Example with grouping by
Offers:
-
Example without groups:
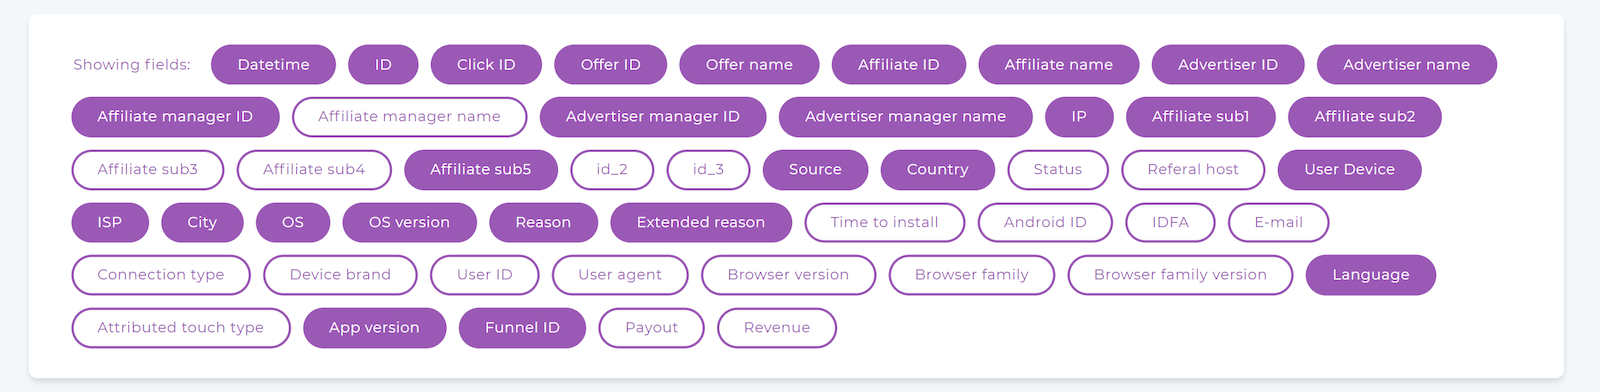
-
-
Buttons for exporting the report to a
.csvor.xlsxfile; - Buttons for switching pages.
Timeline
- The Timeline in the report has the same functionality as in the Dashboard and is also used to display a summary of analyzed conversions for the selected dataset. Hover the mouse cursor over a point on the graph to see detailed conversion information.
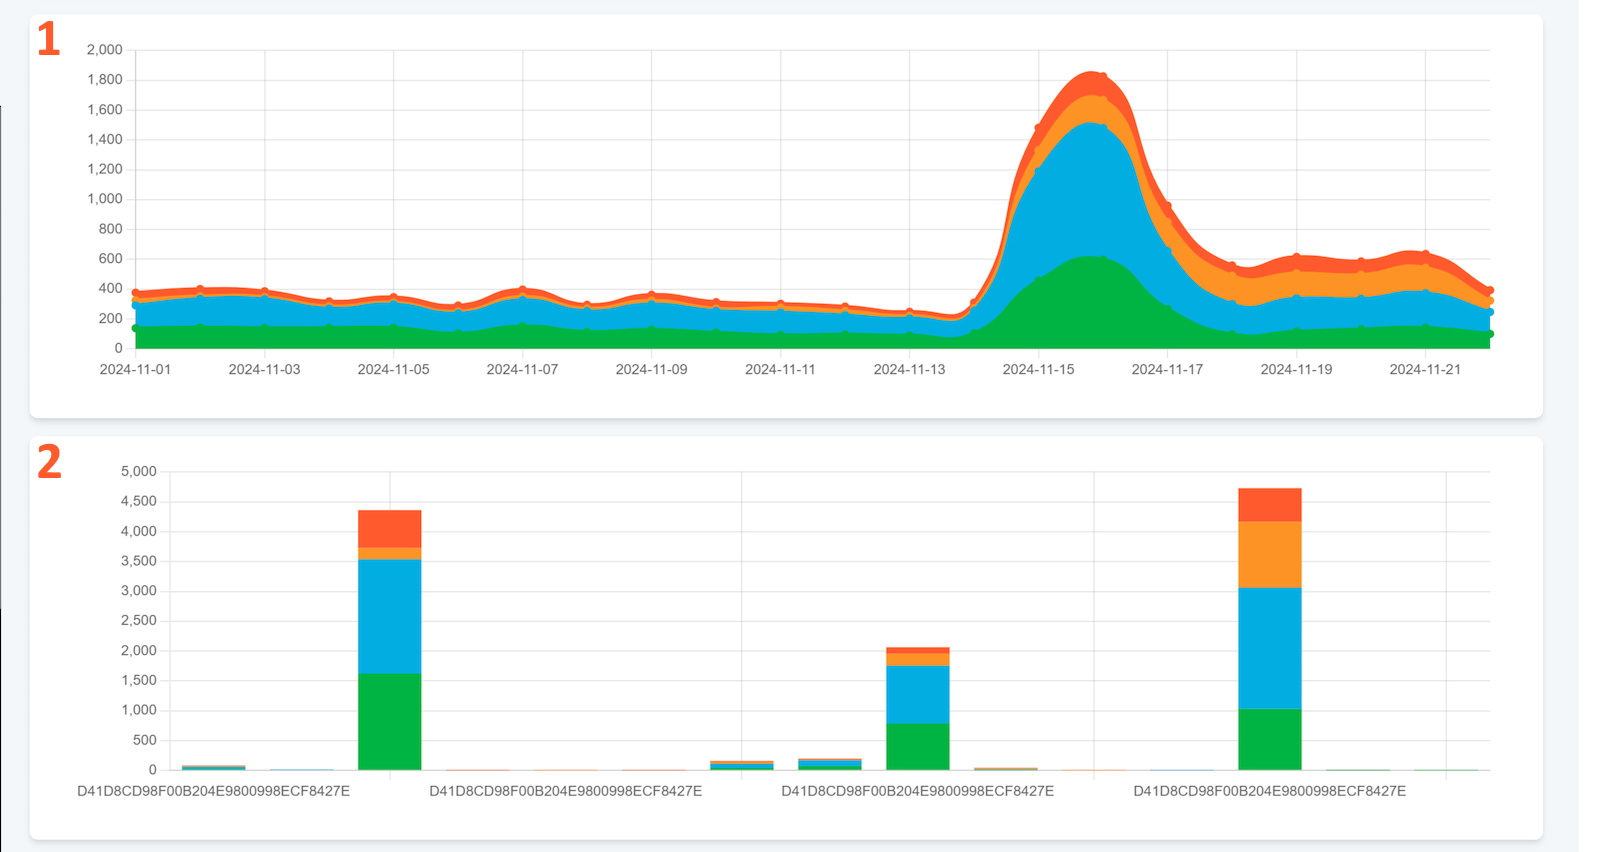
- The bar chart visualizes the division by risk zones for the enabled grouping. Hover the mouse cursor over a colored zone to see detailed conversion information.
aug 24, 2026